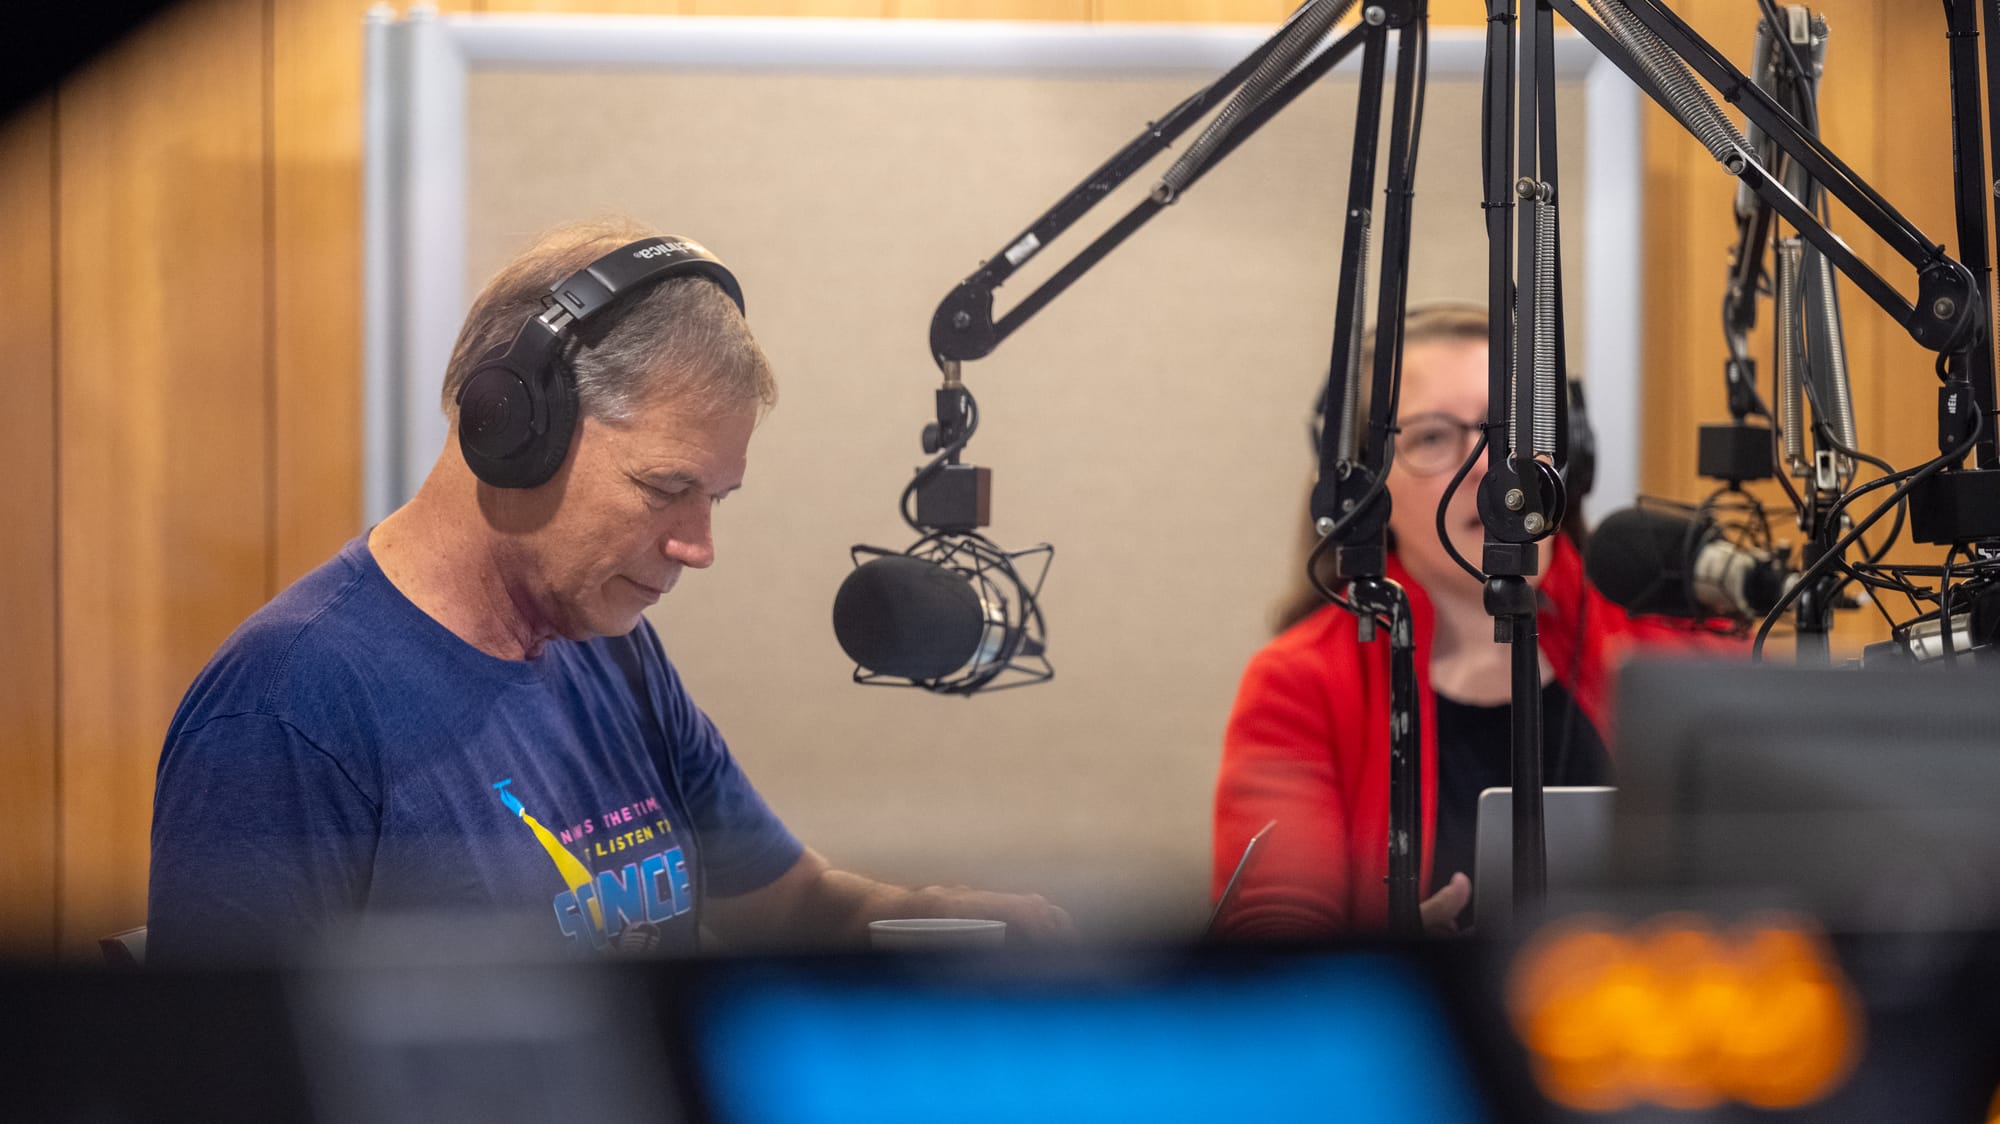
Behind the mic: Meet the minds of the ‘Stats + Stories’ podcast
After nearly 400 episodes, “Stats + Stories” has become a podcast where statisticians, journalists and the curious can listen in to make sense of the world around them.

John Bailer, University Distinguished Professor, emeritus and founding chair of the Department of Statistics at Miami University co-created the “Stats + Stories” podcast in 2013 alongside Richard Campbell, professor emeritus of Journalism from Miami University and columnist for the Oxford Free Press.
Rosemary Pennington, chair and professor for the Media, Journalism and Film Department, joined Campbell and Bailer behind the mic as a moderator and host in 2016. After working together for a few years, Campbell retired and Pennington's role became more prominent on the show.
“I was really nervous when Richard left,” Pennington noted. “John and Richard had known each other for a very long time and I was still new to this.”
Pennington noted that her excitement and curiosity roped her into the new gig. With her journalistic touch and Bailer’s statistically-set mind, the podcast thrived.
Bailer added, “I’ve often been impressed at how similar journalists and statisticians are. I think that we share this kind of interest in science and politics and economics and sports and all of these different areas that we can explore.”
Over time, both Pennington and Bailer have become a “dynamic duo” on the show.
The pair believe that each episode strengthens their respective skills and communication on the show, building character with each guest.
Behind the scenes
According to Bailer, the podcast’s backlog runs deep, with episodes recorded in September not airing until “months and months later.”
Each episode tactically spans around 28 minutes, according to Bailer.
“If you were going to walk to this building from your house,” Bailer said, that’s “about enough time to listen to an episode. We want to have more of a ‘tapas’ target than an entrée.”
Every episode has two sections, with a quick show identification break splitting them.
Behind the scenes, each show is crafted and edited by Charles Blades, a former student of Pennington’s.
Since 2018, Blades has operated the recording equipment inside Williams Hall for each episode of “Stats + Stories.”
Every two weeks, Blades comes into the recording studio early to prep and set up all the equipment for each episode.
“He makes us sound good,” Bailer noted.
Reflecting and re-contextualizing
Among their multitude of episodes together, the pair recalled one show focusing on carbon cycling and whale feces, further highlighting the vast range of topics that vary regularly.
“Some (episodes) are triggered by something that happens in the real world,” Bailer said. “Others are just evergreen science that you just want to understand better.”
The show aims to include more relevant and timely topics, while mixing in more fun and entertaining ones to create variety, according to Bailer.
These topics can range from sports-related content, such as the question of if one should throw a flag to challenge a call in football, to more serious issues such as answering the question of why it is critical to have official statistics operating in countries to make key decisions.
Over the pair’s time on the show, certain episodes have stood out in their minds. For Pennington, one of these shows featured Sir David Spiegelhalter, a globally-recognized British statistician.
Having joined the show multiple times, Spiegelhalter’s presence and discussion focused, at least in one episode, around his book “Sex by Numbers,” which honed in on the issues of sexual behavior with data-driven research.
“The way he was able to talk about statistics was so easy to understand for me to be able to stop and ask questions … (and) to be able to communicate to listeners,” Pennington said.
Early on in the show’s run, Bailer believed it to be a good and fun project, but as time has passed, he believes that the show has undertaken a “greater call.”
“This is critical to have an understanding of information,” he said.
The show works to build trust with its audience by bringing on guests that are statisticians and professionals who can walk through their work with Bailer and Pennington in a colloquial and open environment.
“It makes it easier to trust the work being produced if you understand the questions and thought process,” Pennington added.
Not only does the show function to help explain certain issues and data, but it urges its listeners to look into their own research to form their own conclusions.
“You hear all of the qualifications that people describe around their work to let the audience know that this is trustworthy statistical data,” Pennington said. “But here’s why maybe you want to look somewhere else or maybe you understand that this is only telling you one slice of something.”
Pennington believes that “Stats + Stories” succeeds in helping its listeners “recontextualize the way statistics are produced and used.”
In 2021, “Stats + Stories” won the Joint Policy Board for Mathematics (JPBM) Communications Award, which recognizes individuals or groups for outstanding work in communicating mathematical ideas and information for a general audience, according to the American Mathematical Society (AMS).
When receiving the award, Bailer felt “affirmed” by his work on the show. For Pennington, the award was incredibly important.
“I’m, in some ways, the interloper,” she said. “I do stats and research (in journalism), but I’m not a statistician.”
Receiving this award in 2021 helped Pennington feel further comfortable with her work on the show.
‘Statistics Behind the Headlines’
Bailer and Pennington co-authored the book “Statistics Behind the Headlines,” published in September of 2022, which aimed to answer the age-old question of if journalists do their jobs accurately. In the book, Bailer and Pennington dissected various news stories that utilized statistics.
“We’re using it to educate people on the practice of statistics and also journalism,” Pennington said, adding that “we are both very concerned about the distrust of journalists and distrust of data.”
Each chapter focused on one story, with the two conducting their own research through sources used in the original story.
“We talk about the data used to draw this conclusion,” Bailer said. “And we talk about how they come to these conclusions.”