
‘Moore Maps:’ How the City of Oxford uses maps to organize data
Take a look at the City of Oxford’s Geographic Information Systems.
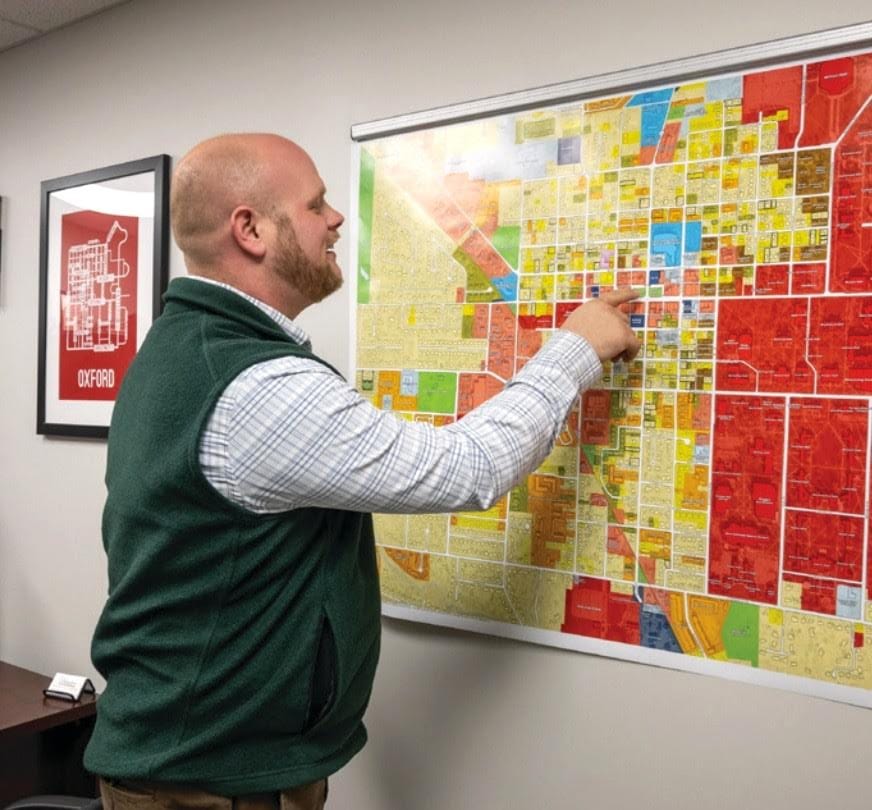
Before Zachary Moore became the City of Oxford’s City Planner and Geographic Information Systems (GIS) Coordinator, he was a kid obsessed with maps.
“I’ve always had a fascination with places, buildings, architecture and travel,” Moore said. “I begged my parents to take me through as many cities or towns as we could.”
Over time, Moore’s passion for maps and city planning became a career.
Moore received his bachelor’s degree in urban affairs and geography from Wright State University. He got his certificate in geographic information science and soon after achieved his master’s degree in community planning from the University of Cincinnati.
Moore got his start in Oxford as a city planner. In 2022, Moore added another ‘hat’ to his collection when he took up the GIS Coordinator role.
“I am passionate about both [roles]," Moore said. “To me, they are kind of inseparable from each other.”
Moore highlighted the importance of informing the community through his work in GIS.
“There are folks out there, especially Oxfordians, who are civic-minded, really care about the community and want to know what’s going on,” Moore said.
Moore spends his days updating and adding to Oxford's GIS with relevant and up-to-date information.
Moore has helped advance Oxford’s GIS into the cloud environment. The premier software for GIS, called ArcGIS, is made by a company called Esri, which stands for Environmental Systems Research Institute.
Moore has tasked himself with moving all of Oxford’s data, maps and content to this new platform.
“Perhaps project is too small of a word,” Moore said. “It’s just been a multi-faceted endeavor to try to build up [Oxford’s] overall infrastructure.”
Oxford’s GIS is constantly updating and changing, reflecting the inner movements and detailed changes that the city enacts.
These services are used by city-mandated boards to help better grow and shape the community efficiently and effectively.
“There’s a lot of ways to leverage mapping and data collection for a variety of purposes for municipal government,” Moore said.
From an active transportation GIS map to details on what specific businesses are a part of the Uptown Historic District, Moore believes that each map provided by the city reflects important information that Oxfordians can discover and use to better their community.
Active Transportation
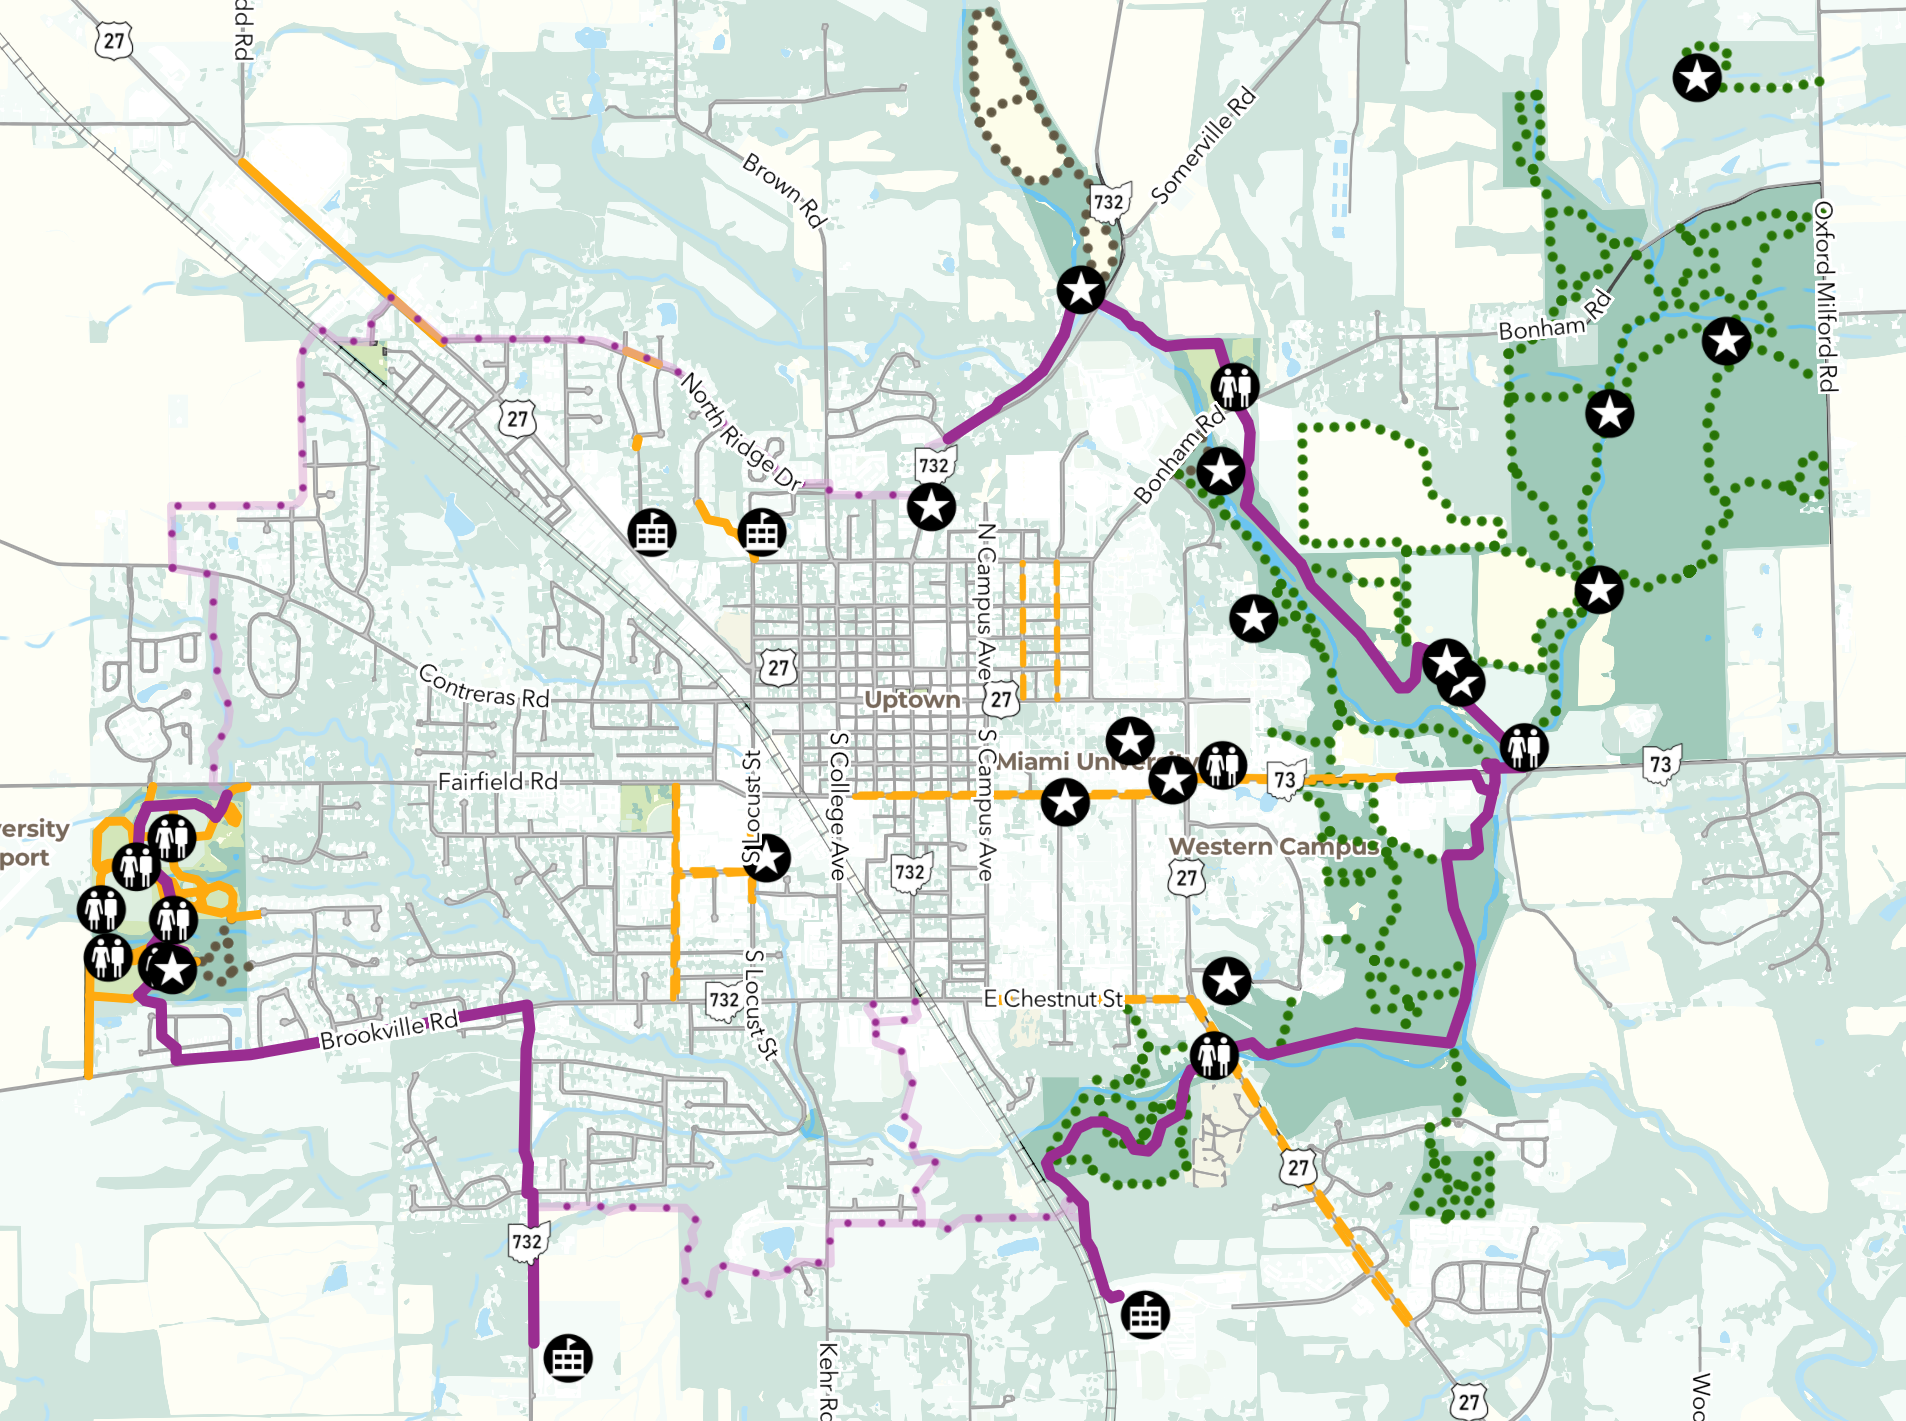
The first main interactive map on the City of Oxford’s GIS page focuses on active transportation around the area.
Points of interest, restrooms and school buildings are each marked by individual markers shown inside black circles.
The map also features different types of lines that indicate routes and trails across Oxford. The solid purple line shows completed Oxford Area Trails System (OATS) trails, while the somewhat faded and dotted purple lines show future OATS routes.
Moore noted that the end goal of these OATS routes is to have a constant loop of trails that goes all around Oxford.
Also included in the active transportation map are solid yellow lines, which showcase multi-use paths that are not part of OATS.
On-street bike lanes are represented by split yellow lines throughout the map.
Dotted green lines are part of Miami University Natural Area Trails (MUNA).
Finally, other nature trails that aren’t a part of MUNA or OATS are marked by dotted grey lines on the map.
Address & Property Viewer
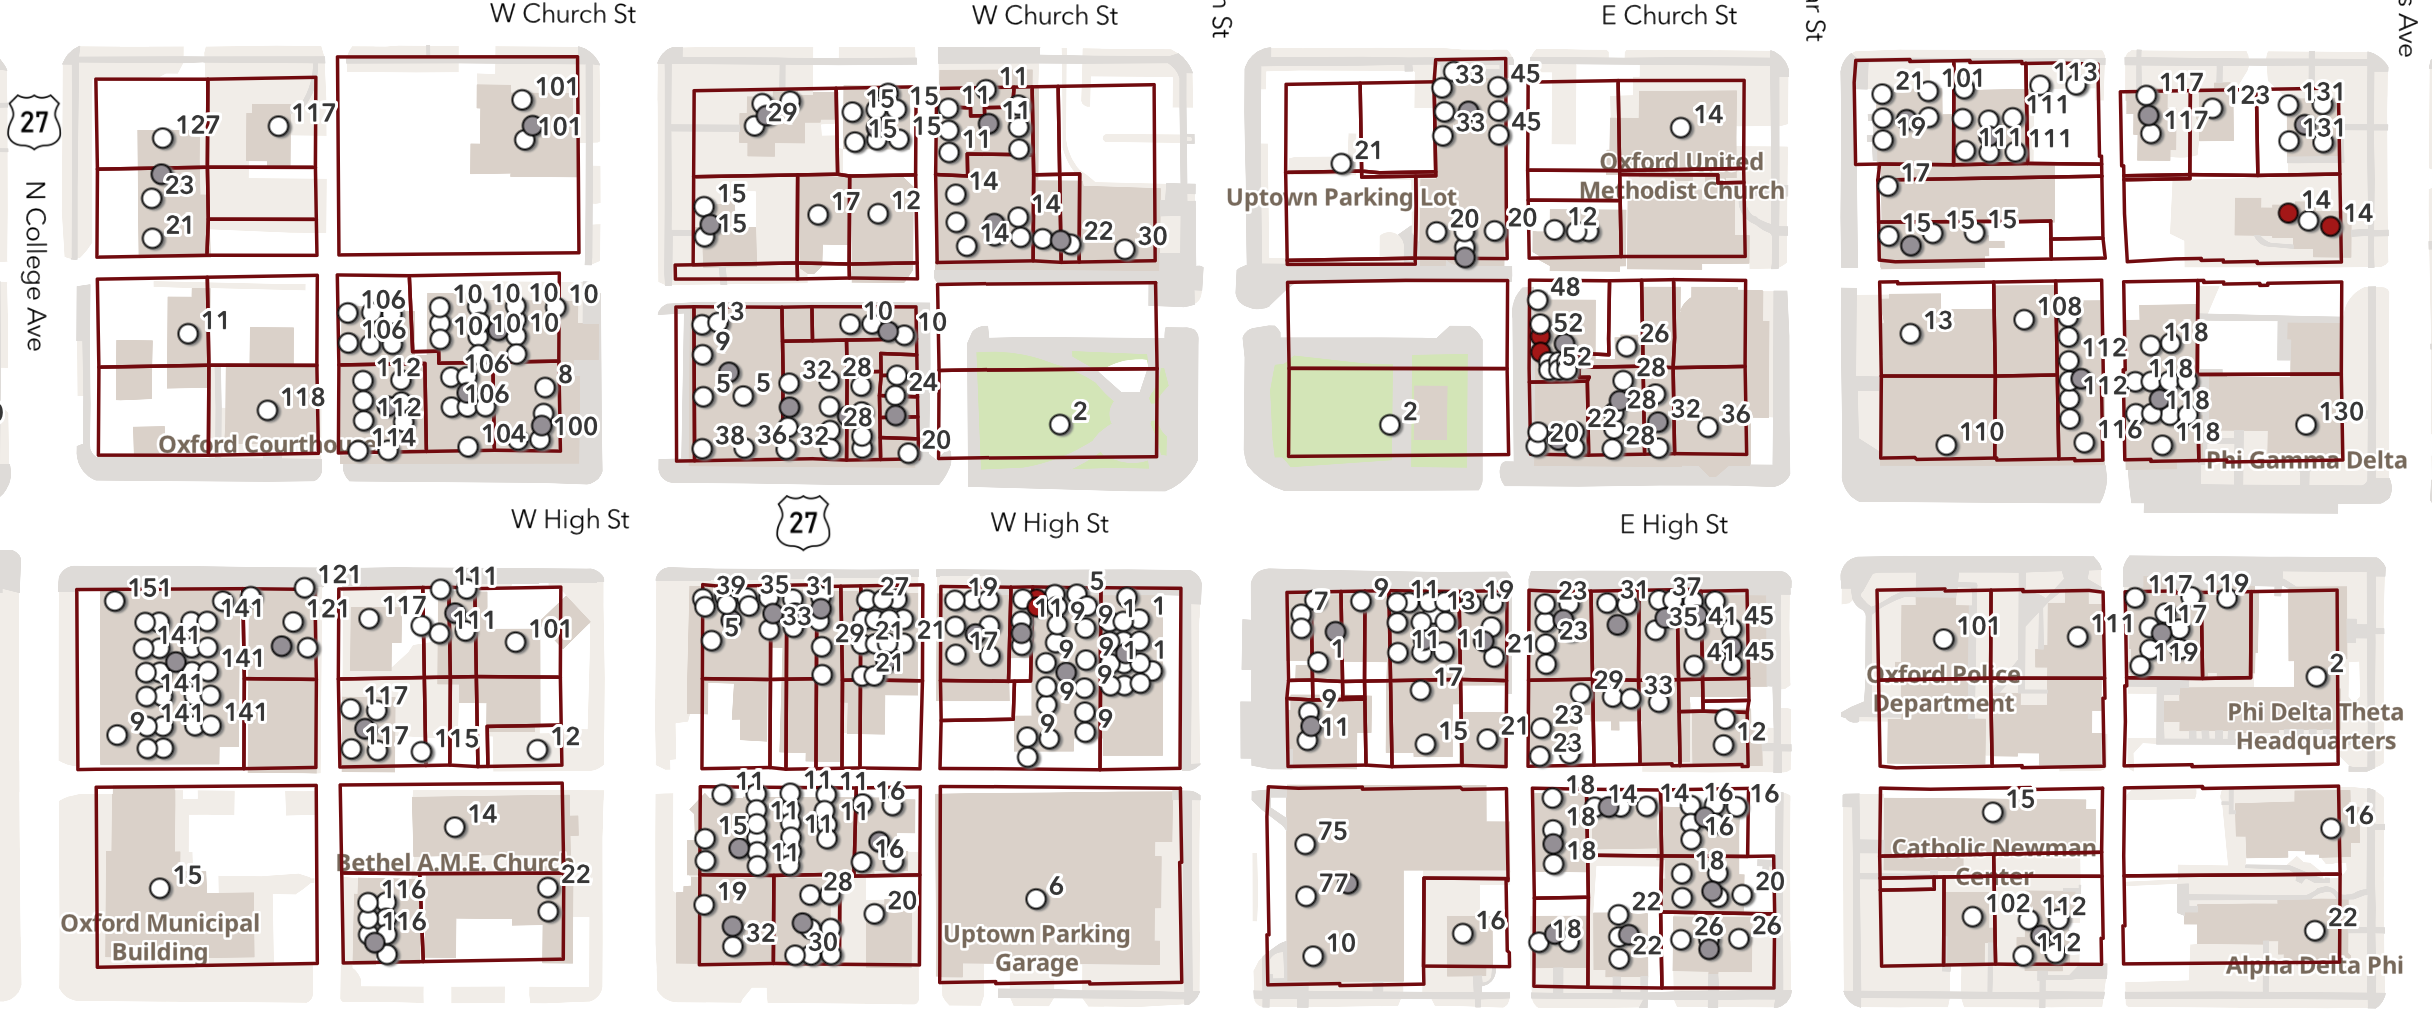
The next featured map focuses on individual buildings and addresses.
“Anytime there is a separate unit, business or space, [this map] represents it as a point,” said Moore.
When clicking on each circle-shaped marker, viewers can receive information about the space, such as the coordinates, address and even the name of the property owner.
The orange marker, labeled “pending,” indicates when someone is planning on building a new property.
“Anything that is white,” Moore said, “is an address where a building permit has been submitted, at the very least.”
The white maker, labeled “current,” also includes active residences where people live and can indicate multiple units on a single property.
The grey marker, labeled “other,” shows the overall addresses of buildings. The marker encompasses all addresses within a given building.
In this case, two apartments in one building would appear as two separate white dots on a map. The grey marker allows for these individual dots to be combined into one, all-encompassing address.
The “retired” marker indicates residences that were demolished or changed.
Future Land Use Viewer
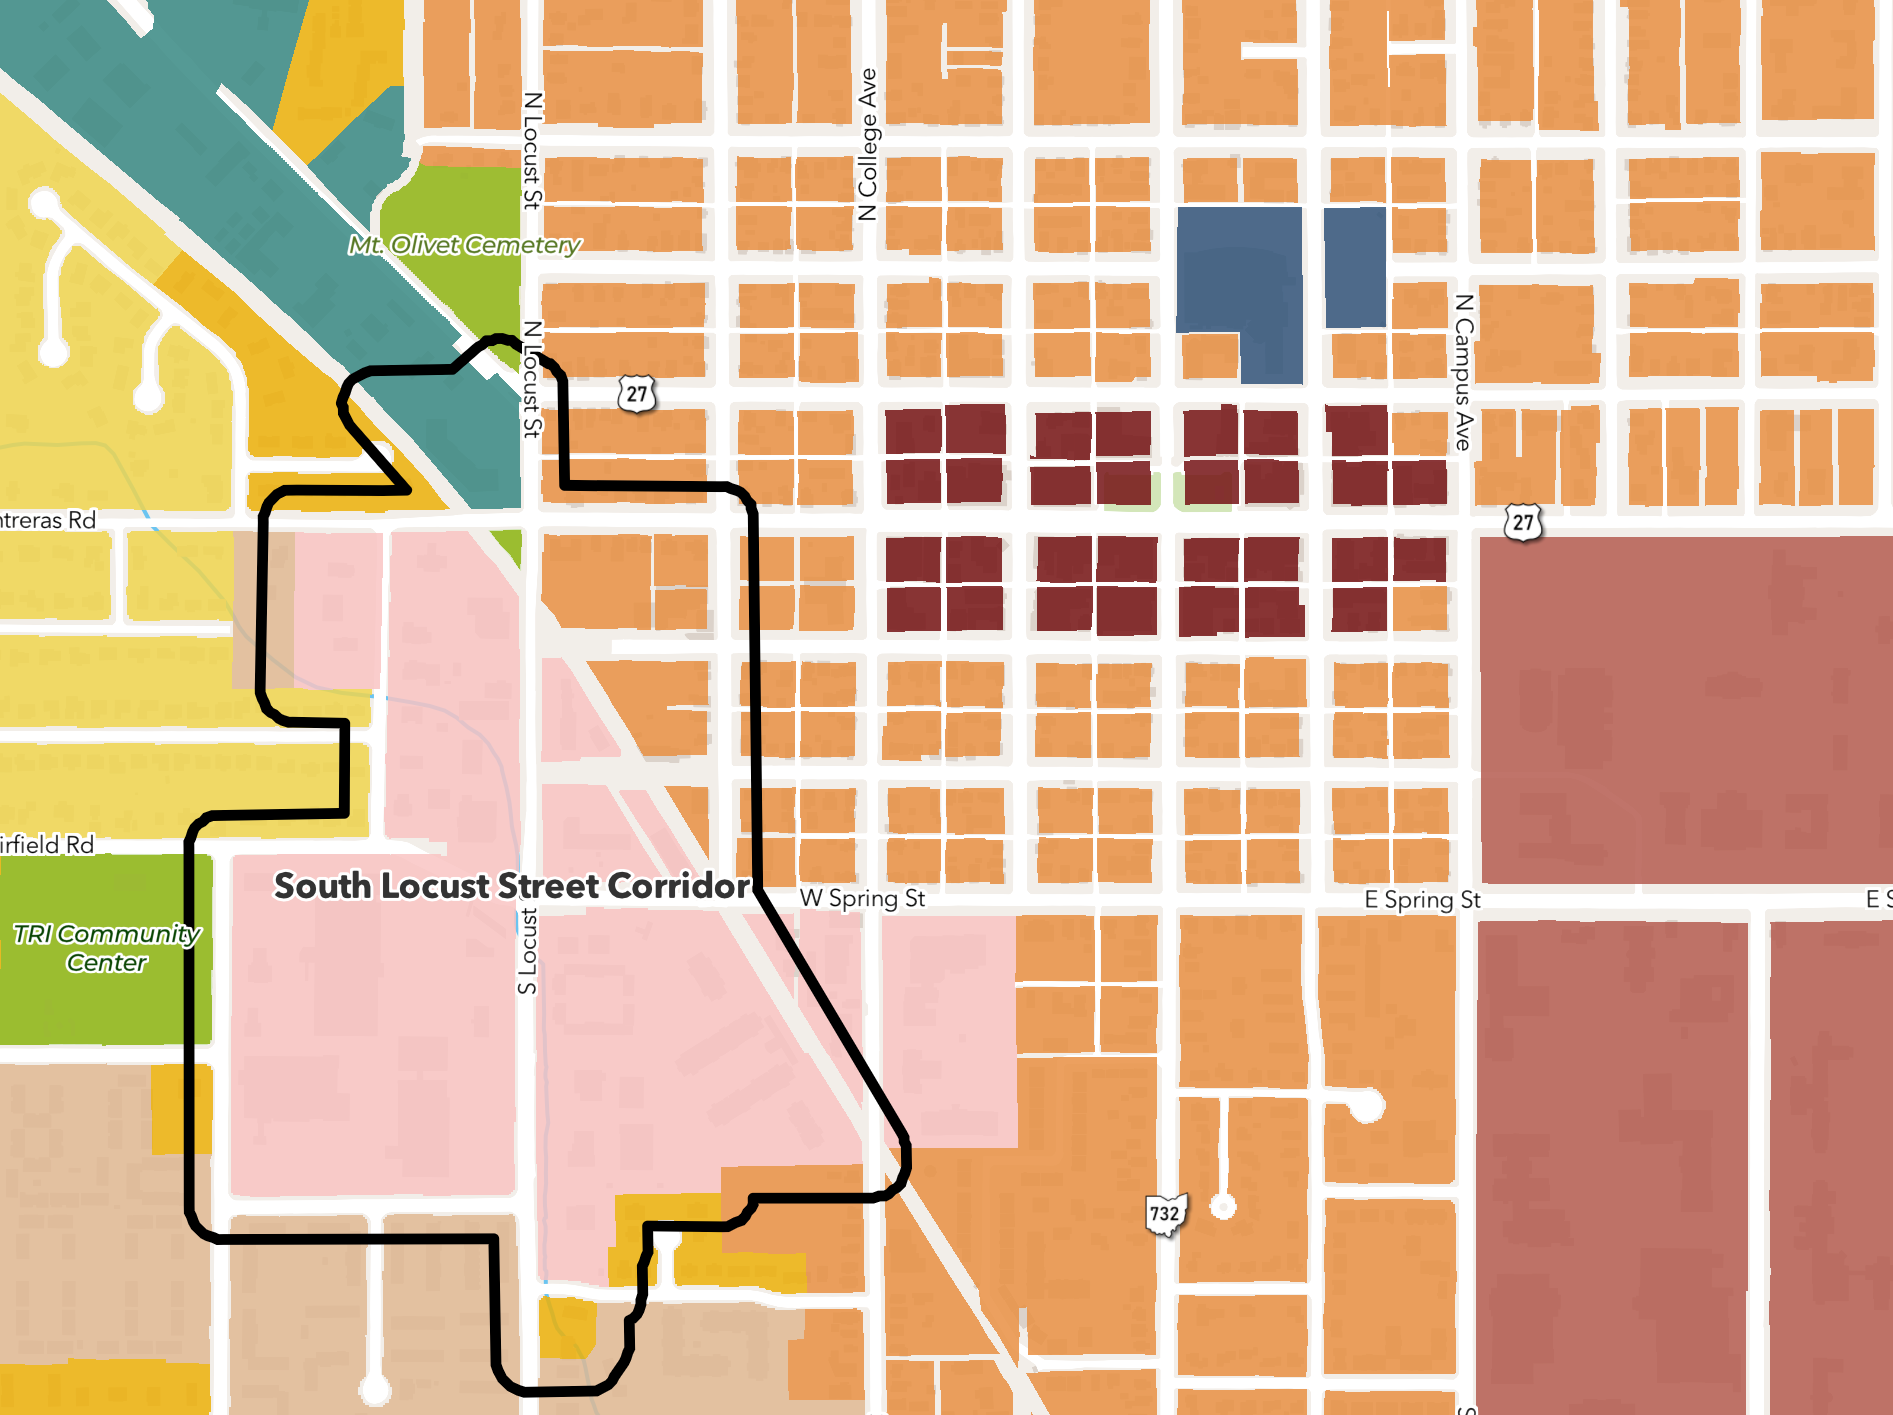
The next system shows land use areas across Oxford.
All land highlighted in red indicates campus, university-owned land.
The lavender-colored areas show “flex industrial” locations in Oxford. According to the GIS, these areas are “characterized by employment uses like light industrial, distribution, and logistics.”
The lime-colored areas indicate rural lands, while the green-colored areas indicate nature preserves and green spaces.
The more residential areas have a variety of colors and detailed organization.
The areas highlighted in yellow indicate suburban neighborhoods, while the darker yellow-colored areas show transitional suburban neighborhoods.
The main difference between these markers is important. Transitional suburban neighborhoods allow for attached residential units, such as duplexes and townhomes, while standard suburban neighborhoods do not.
The beige-colored areas indicate urban neighborhoods, which are characterized by various housing types, different land uses, easily walkable areas and green open spaces.
Areas like the Uptown Historic District are categorized by a dark red color. This indicates an urban core area notably filled with buildings that have retail or commercial businesses on the bottom floor and multi-family residences on the upper floors.
The deep orange-colored areas on the map show the urban mile-square neighborhood, the largely student-populated area in Oxford.
This map features a variety of other markers for viewers to check out.
Planning and Zoning Case Viewer
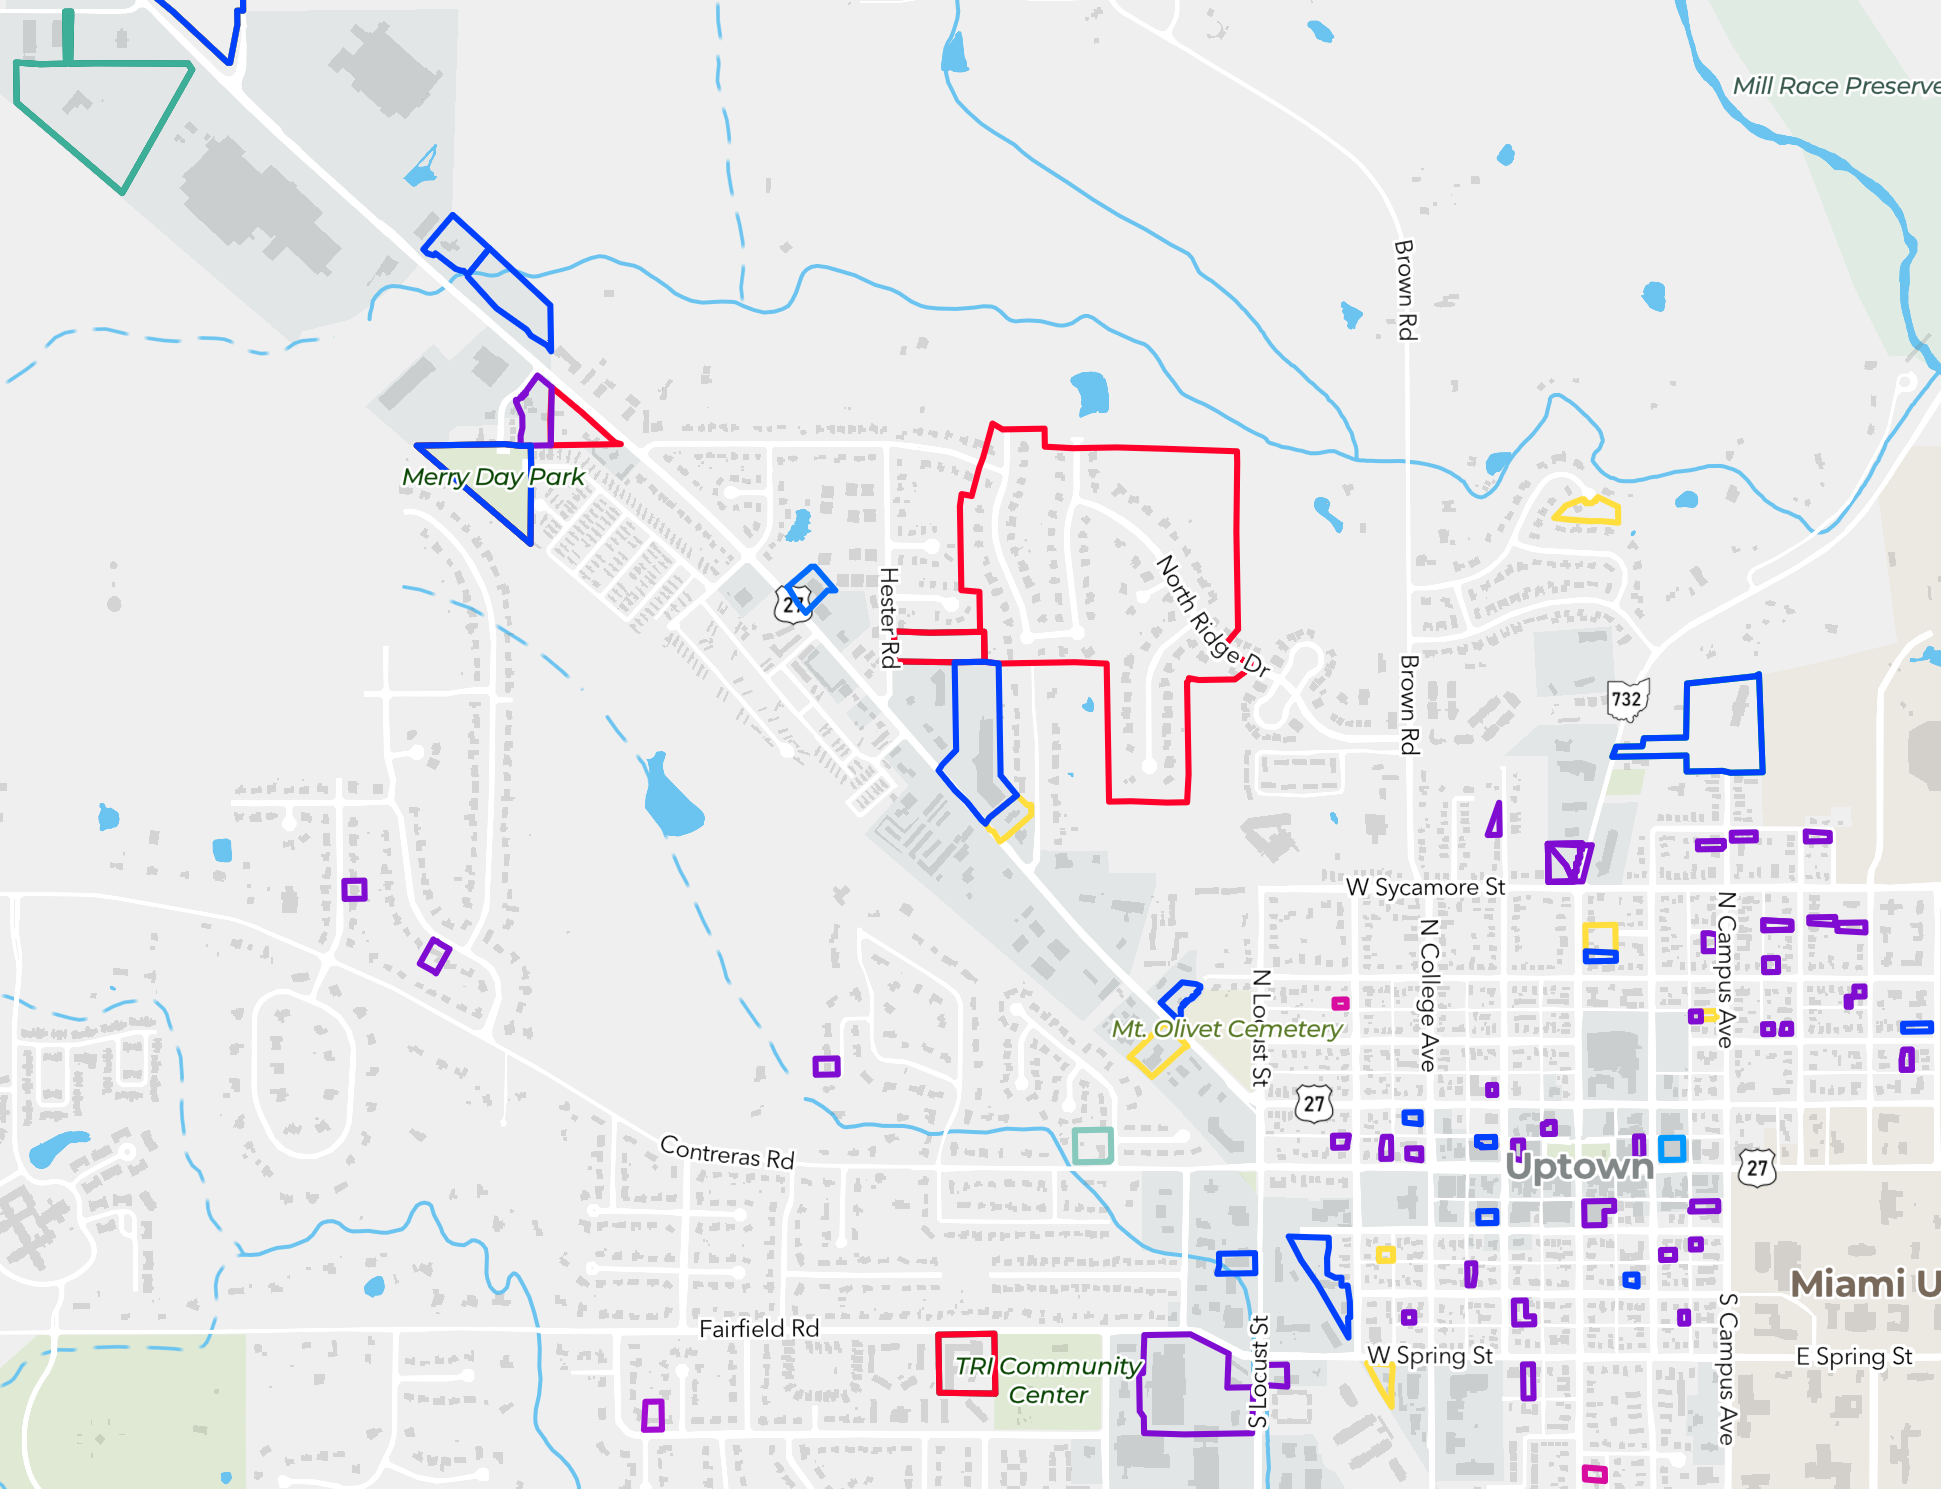
This GIS focuses on planned projects and zoning areas across the city.
The yellow-highlighted area shows split lots and consolidated areas, which include requests to combine different parcels of land into one parcel, or vice versa.
This map also allows visitors to view variances, which are requests by residents for their properties to deviate from standard rules and regulations set by the city. These areas are marked in purple.
Alongside other features on this map, Oxford’s Board of Zoning Appeals uses this GIS to help residents determine what and if they can build something on their property.
Other GIS Systems
The City of Oxford GIS has a variety of other maps and features.
“I did some research at one point where I was looking at the original plots for Oxford,” Moore said. “You can view the original plotlines by year.”
This feature showcases plots of land in Oxford from its 16 blocks of the original 1810 town to all planned developments today.
“A lot of that [information] was uncovered just by looking at the historical plots,” Moore said, "which are available at the county level.”
Oxford’s GIS also has a map dedicated to showing every smoke and vape establishment in the city. With this specific map, viewers can also view these establishments’ proximity to youth-oriented facilities, such as schools and libraries.
Additionally, Oxford’s GIS has a map showing community parks, which include specific points and locations for sporting facilities, drinking fountains, playgrounds and active transportation routes.
“You can see just how useful and powerful it is to have all of this data at your fingertips for services that a city would be responsible for,” Moore said.
To explore Moore’s work on Oxford’s GIS, visit the City of Oxford website.